


If you’re running A/B tests using GemPages, gaining meaningful insights from the results is key to making data-backed decisions. While the A/B testing report inside GemPages offers a streamlined overview, you can also dig deeper by cross-referencing these results with Google Analytics 4 (GA4).
Please be noted that GemPages does not gather any internal statistics but instead utilizes the data collected by your Google Analytics account. Go to GemPages Dashboard > A/B Testing and select your preferred campaign, you can check the report from Google Analytics by clicking on the button on the left of the settings button.
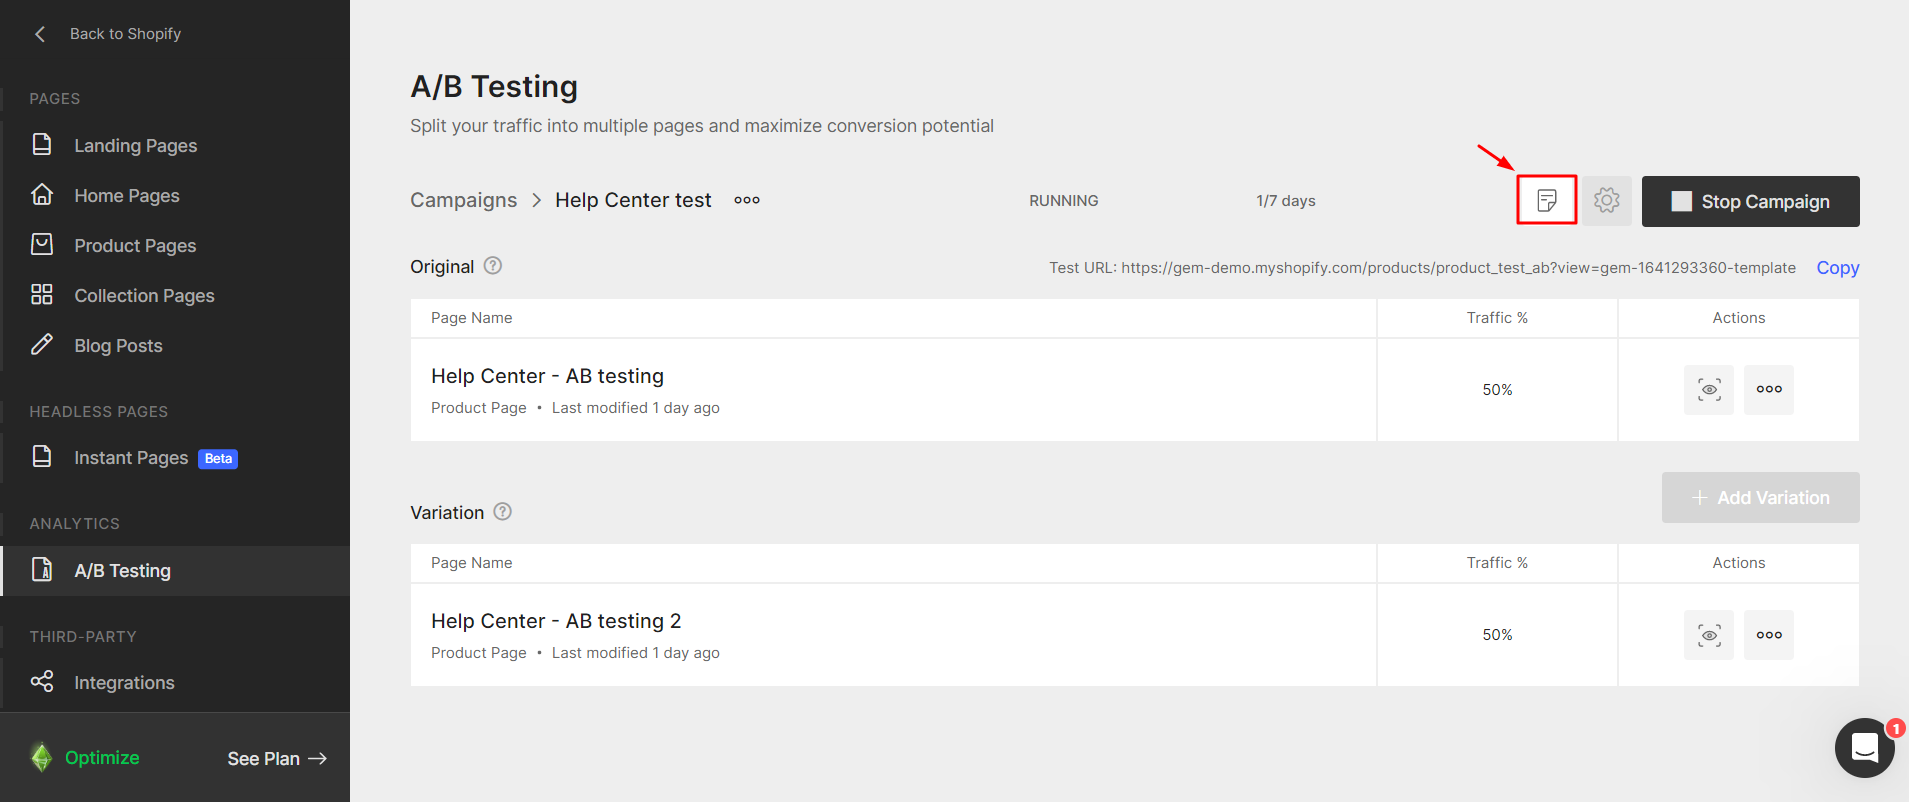
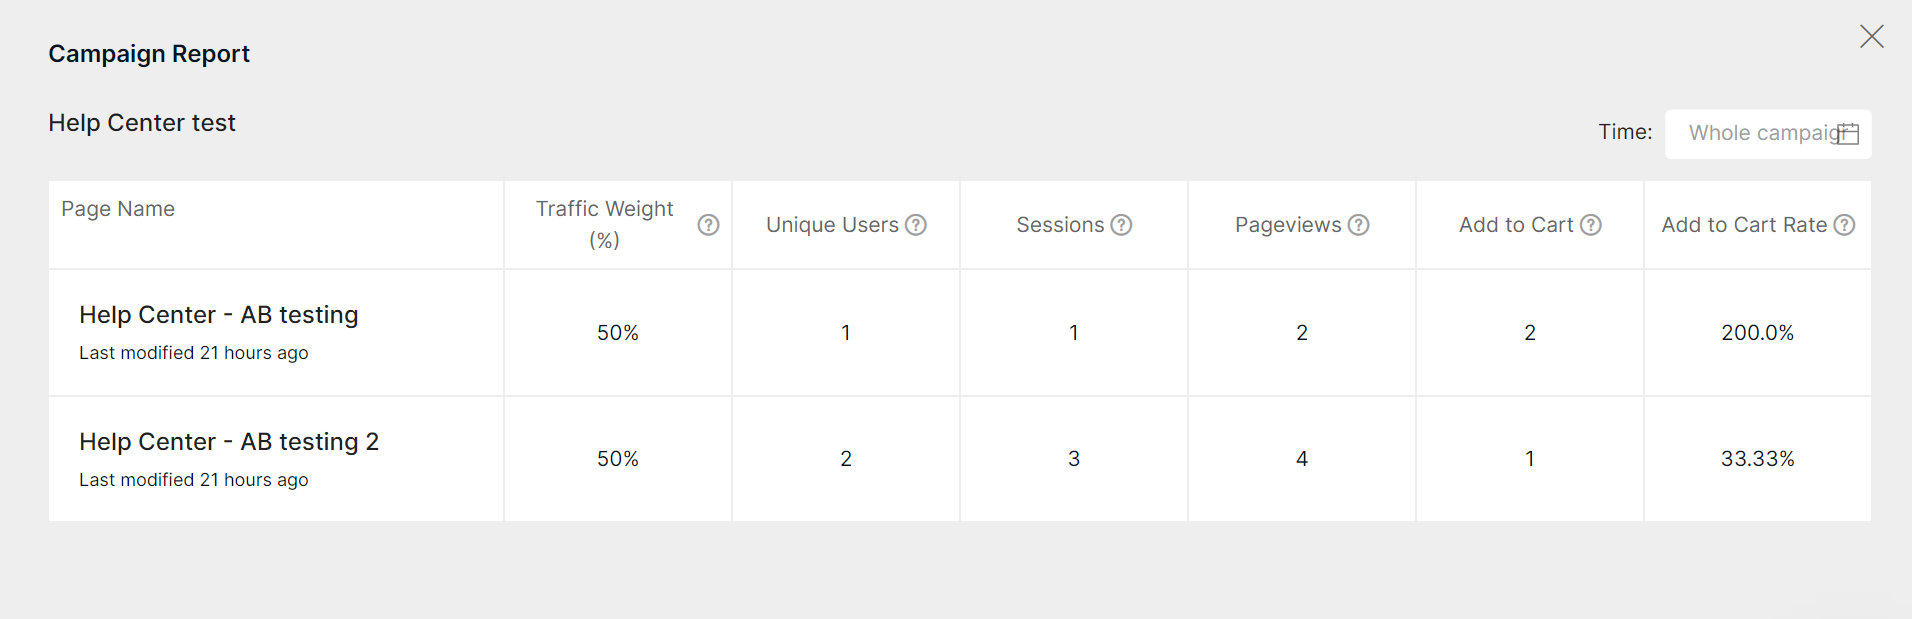
The campaign report displays traffic weight and five key metrics since the Conversion and Conversion rate metrics have been temporarily disabled for technical updates. We will improve the accuracy of these metrics and expect them to be available again in the near future.
If you prefer, you can locate these metrics on the Google Analytics dashboard instead of using GemPages. We will guide you through the steps to identify the source of each metric through this article.
Step 1: Locate Your Campaign ID & Variant ID
To track the correct variant data in GA4, you’ll first need your Campaign ID and Variant ID.
How to Find Your Campaign ID:
- From the GemPages Dashboard, navigate to the A/B testing feature. Select your preferred campaign.
- The Campaign ID is the number following “/experiments/” on your URL.

How to Find Your Variant ID
- From the GemPages Dashboard, locate the page that is being used for the A/B testing campaign.
- Click on the three-dot button and select the “Preview” option.

- The variant ID would be the number after “?preview=” on your preview page’s URL.
 Step 2: Customize your Google Analytics report
 Step 2: Customize your Google Analytics report
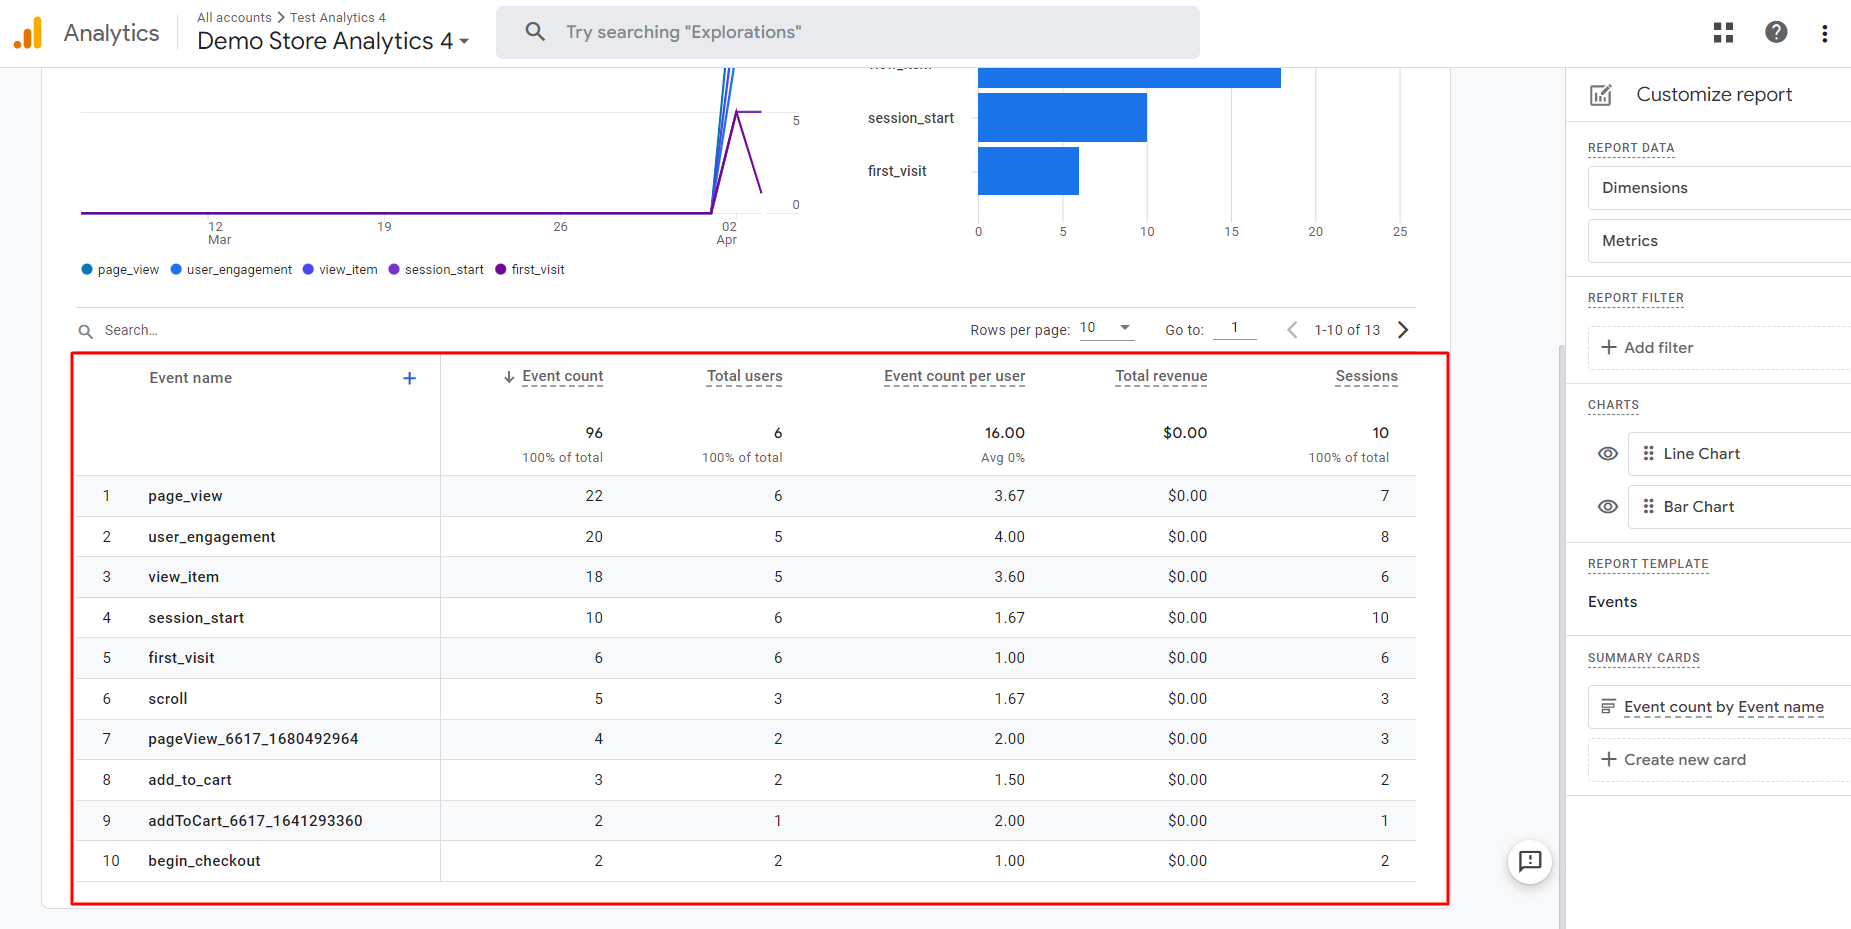
- Go to Reports > Engagement > Events in your Google Analytics dashboard and click the Pencil icon in the top right corner.
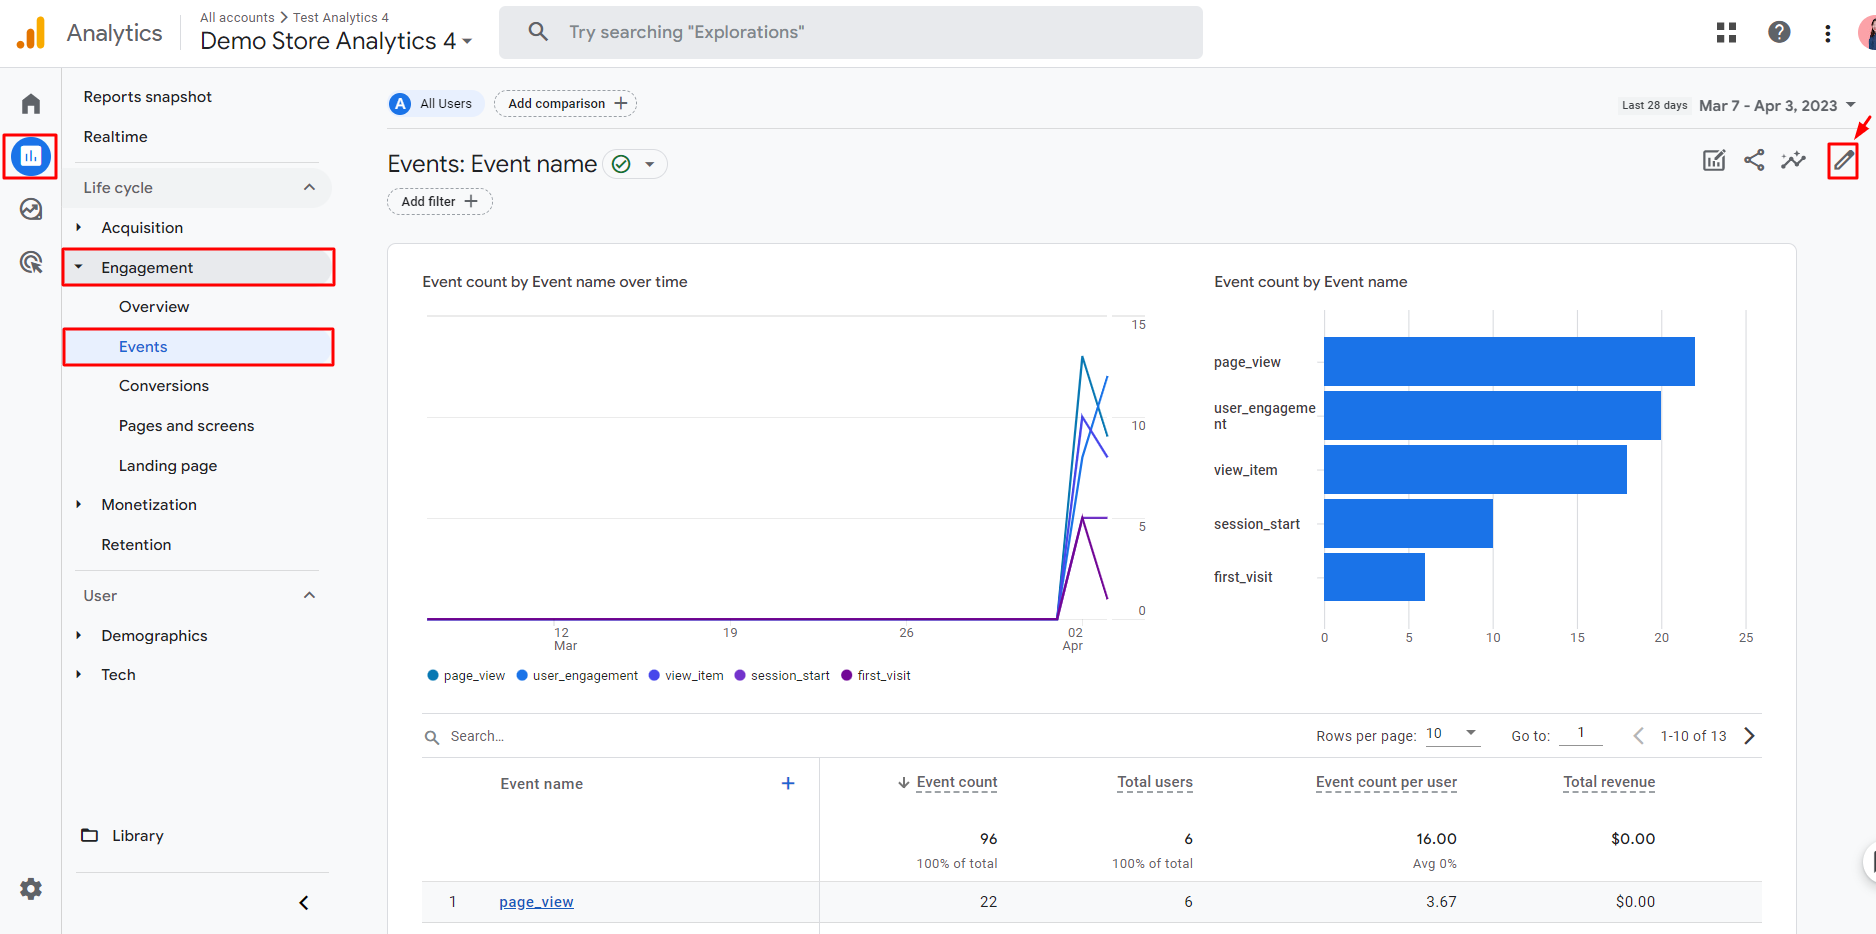
- A new window will open, allowing you to customize your report. Click on Metrics > Add metrics and search for the Sessions metric using the search bar. Click “Apply” when finished.
- After completing these steps, you will be able to view a report that contains the key metrics of your A/B testing report.
 Step 3: Locate the key metrics in the report
 Step 3: Locate the key metrics in the report
Unique Users, Page Views, and Sessions
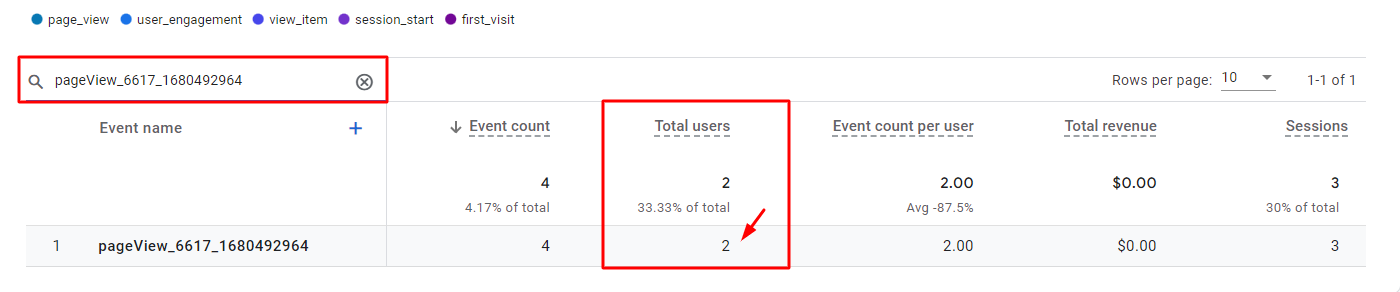
Search for the term “pageView_campaignID_variantID”, for example, “pageView_6617_1680492964”.
- Unique Users: You will see the Unique Users number displayed in the “Total user” column.
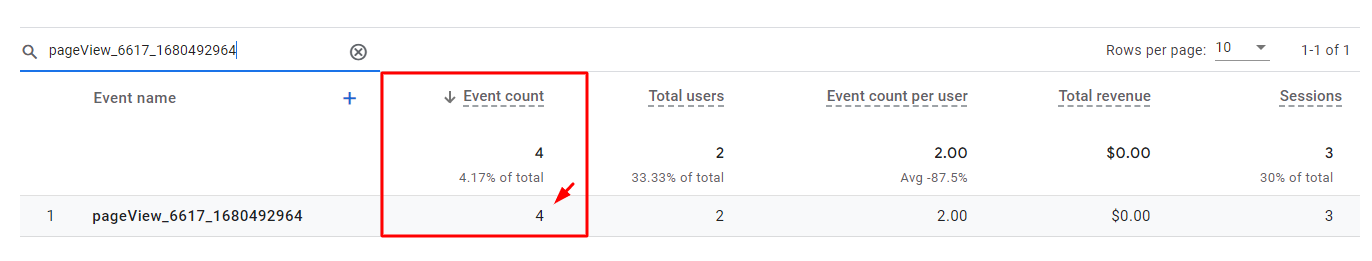
- Page Views: The Page views data is displayed in the “Event Count” column.
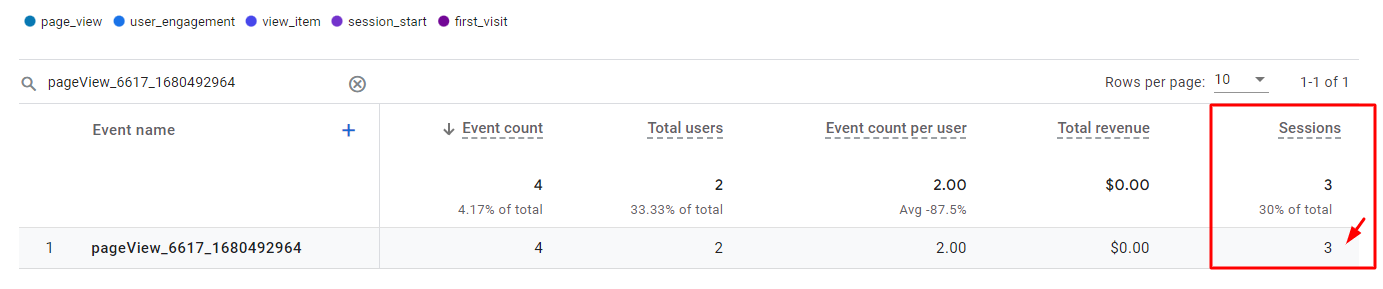
- Sessions: The number of session data can be found in the corresponding column.
 Add to Cart & Add to Cart rate
 Add to Cart & Add to Cart rate
To find the Add to Cart statistics, search for “addToCart_campaignID_variantID” (e.g., “AddToCart_6617_1680492964”) and look in the “Event Count” column.
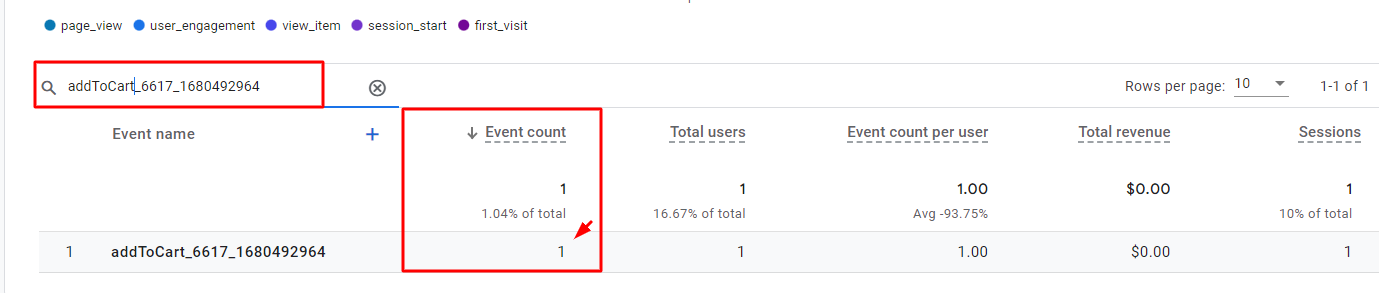
The Add to Cart Rate metric is calculated by dividing the Add to cart number by the number of Sessions.
By following these steps, you can review your A/B testing data from both GemPages and Google Analytics.


Thank you for your comments